


As a team of developers, operations researchers, and data scientists, we understand that sometimes you need your data to find its way to specific platforms for further analysis. In this post, we’ll walk you through what data is available to pull from Nextmv app runs – and how to get it into Google Sheets.
Runs, run history, and run details
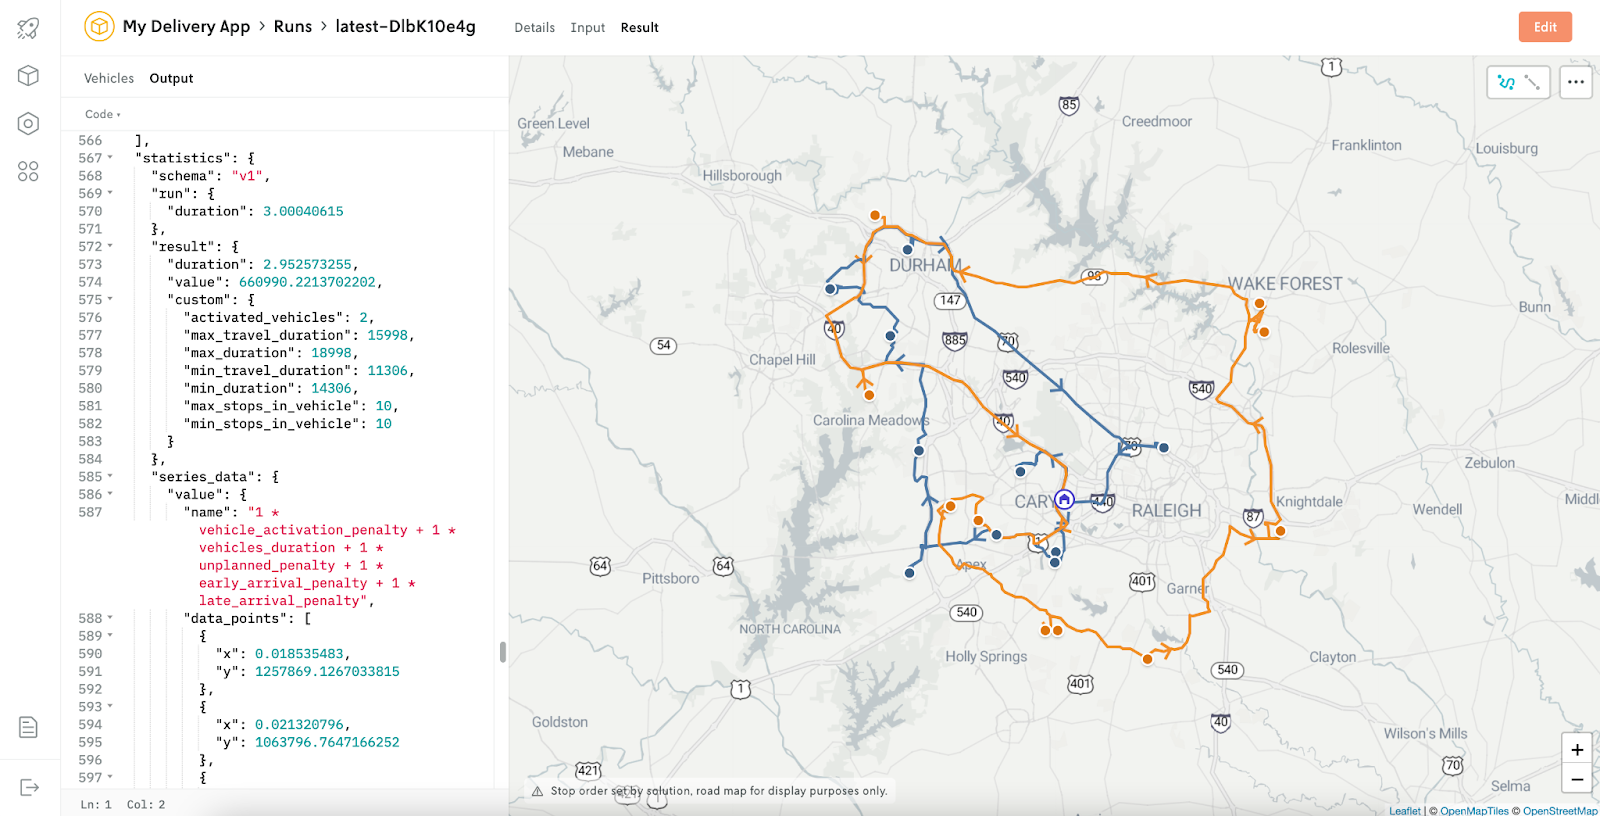
Nextmv is a decision tooling platform that enables algorithm developers to build, test, deploy, and manage their models. You can create a routing app in a few clicks and then run your app using unique API endpoints.
The Nextmv console includes the run history for your decision apps. When you run the app, you of course get the solution, but you also get metadata and output statistics. You can click into each one to see the routes on the map as well as more details like run duration and number of vehicles used.
Pulling run details into Google Sheets
If you want to do further analysis on your runs, you can easily pull that data into a spreadsheet or other application using a script. We’ll talk through an example of how to pull runs into Google Sheets, but you can use the API endpoint and a custom script to grab your run data and send it to the destination of your choice.
Why would I want to pull run history?
In this example, we’re going to talk about pulling run history on an ad-hoc basis. This can be particularly useful in understanding performance and KPIs for reports that need to be shared with stakeholders.
One reason you may want to pull recent runs into another tool would be to understand the performance of your app. You may want to analyze (and visualize):
- Run duration (How long did the run take?)
- Result duration (How long did it take to find the result?)
- Status (Was it successful? Was there an error?)
Another reason would be to understand how your business-specific KPIs have been performing recently:
- Number of unplanned stops (How many stops are not assigned to a vehicle?)
- Number of vehicles used (How many vehicles were used in the solution?)
- Min and max travel duration (What’s the least amount of time a route takes? What about the most amount of time?)
What fields can I pull?
In terms of what you want to analyze, it’s really up to you! A full list of the available fields for a route optimization app from the run output can be found in the documentation. Here are examples:
- Date / Time
- Run ID
- Run duration (How long did the run take?)
- Result duration (How long did it take to find the result?)
- Result value (What’s the solution value?)
- Status (Was it successful? Was there an error?)
- Activated vehicles (How many vehicles were used in the solution?)
- Unplanned stops (How many stops are not assigned to a vehicle?
- Min travel duration (What’s the least amount of time a route takes?)
- Max travel duration (What’s the most amount of time a route takes?)
- Min stops in vehicle (What’s the least amount of stops any vehicle has?)
- Max stops in vehicle (What’s the most amount of stops any vehicle has?)
Note: Custom metrics, which allow you to define your own fields with custom logic behind them, are also possible so you can track KPIs specific to your business. Reach out to learn more!
How do I do it?
The Google Apps Script snippet below will get you started by connecting to your app and inserting run data into Google Sheets. The example includes paths to all of the output data available so you can easily include the paths you need based on what you’d like to analyze.
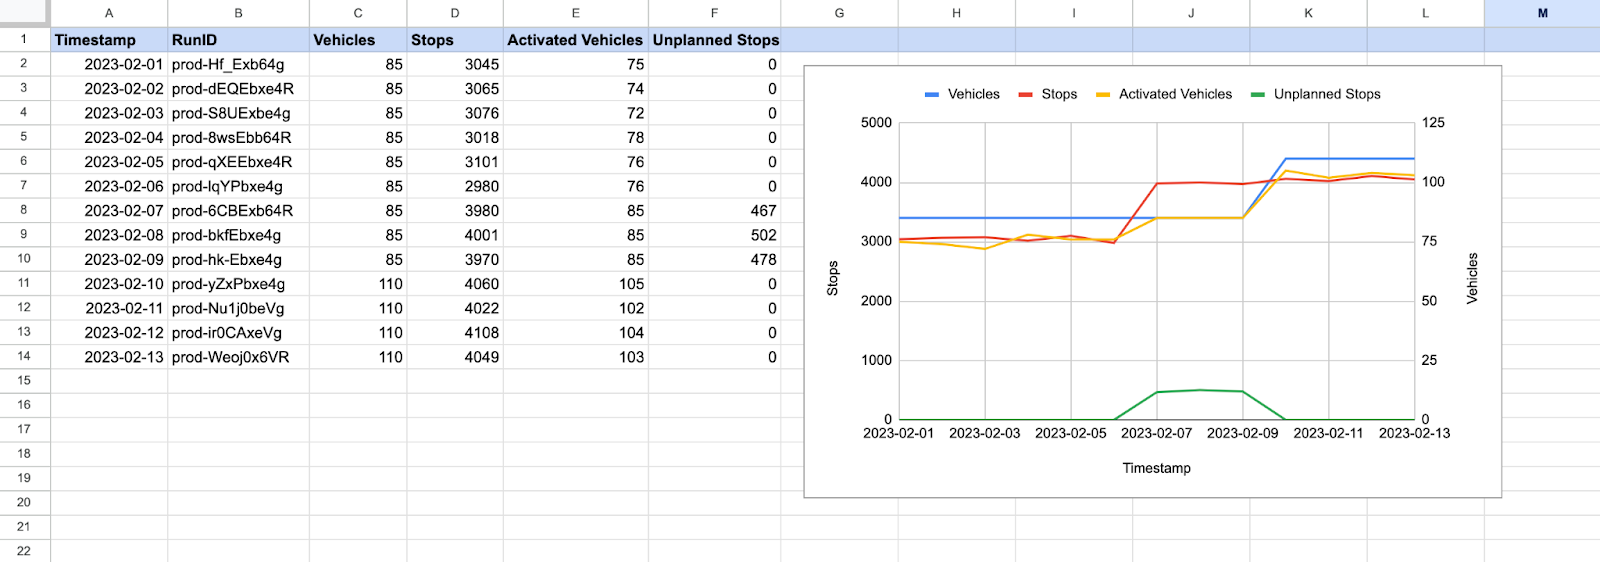
Let’s look at an example of analyzing run details in Google Sheets. We can see that on February 6th there was an increase in the number of stops that we were trying to plan, which resulted in a spike in unplanned stops. To handle this increase in demand, we added more available vehicles on February 9th. With more vehicles ready to service the increased number of stops, we can see that the number of unplanned stops went back down to 0.
Note: We’re using custom output to include ‘stops’ and ‘vehicles’ in this example to illustrate the story. These are simply the number of stops and vehicles used in the input file.
Get started
Sign up for a free Nextmv account and get started today! Create an app and make your first run in just a few minutes.
Share what you’re working on – we’re always interested in how people are building with and extending Nextmv. Have questions? Reach out to us anytime.
.png)


